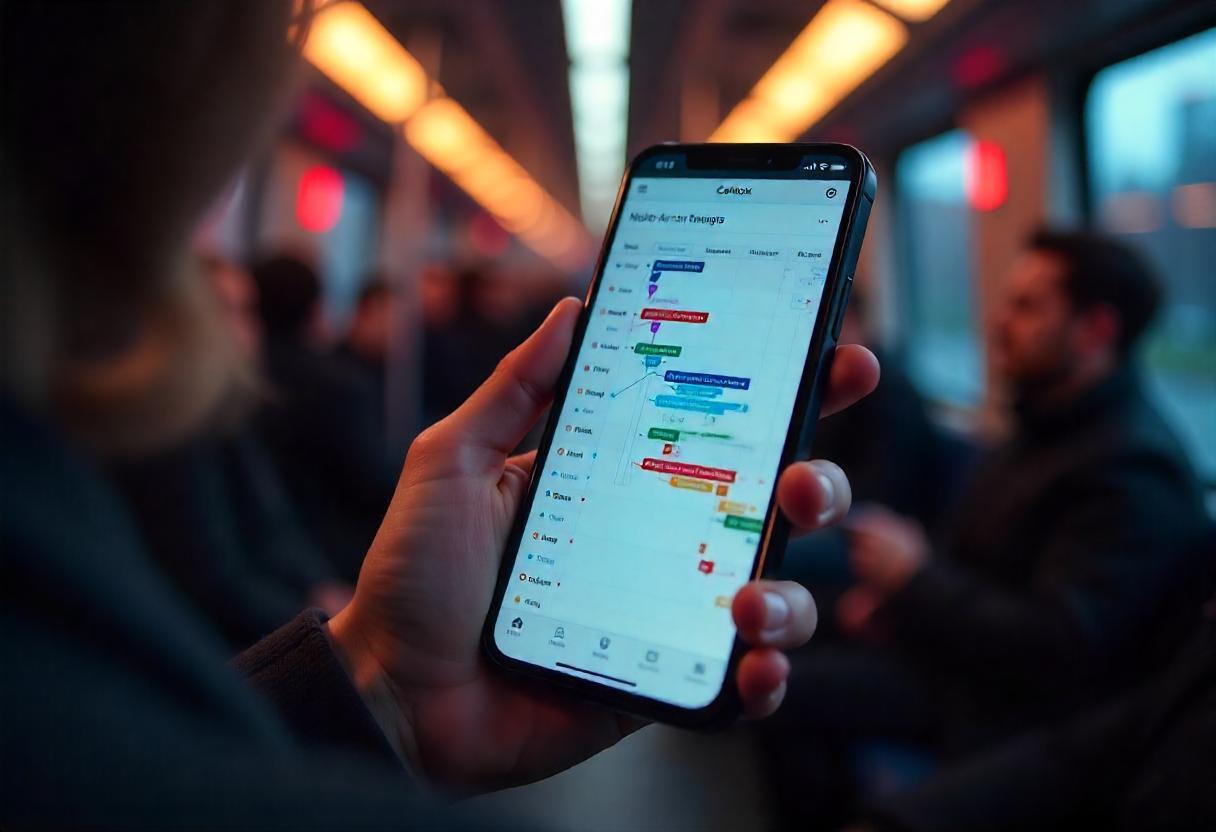
In the world of modern project management, clarity, precision, and timely execution are crucial. One of the most reliable tools for achieving these goals is the Gantt chart. Widely adopted across industries, Gantt charts help teams visualize tasks, track progress, and ensure timely project delivery.
This comprehensive guide will walk you through what a Gantt chart is, how it works, why it's essential for project managers, and how Celoxis, an all-in-one project management software, enhances Gantt chart functionality for better results.
What is a Gantt Chart?
A Gantt chart is a bar chart that outlines a project schedule. It visually represents tasks along a timeline, showing when each activity begins and ends. Originally introduced by Henry Gantt in the early 20th century, it has become a cornerstone of project management.
The Gantt chart in project management enables managers and stakeholders to clearly see:
-
The sequence of tasks
-
Dependencies between activities
-
Project milestones
-
Real-time progress
Why Gantt Charts Matter in Project Management
Project managers often face challenges such as miscommunication, deadline slips, and lack of visibility. Implementing a project Gantt chart helps overcome these issues by offering a transparent view of the entire project timeline and structure.
Key Benefits of Gantt Charts:
-
Improved planning and time estimation
-
Enhanced task tracking and milestone visibility
-
Efficient resource allocation
-
Better communication among team members and stakeholders
-
Proactive risk management by identifying dependencies and bottlenecks
Key Components of a Gantt Chart
To utilize Gantt chart project management effectively, it is essential to understand its core components:
-
Task List: Breakdown of all tasks required to complete the project
-
Timeline: Visual representation of task durations
-
Dependencies: Relationships between tasks (e.g., Task B can’t start until Task A finishes)
-
Milestones: Significant checkpoints or deliverables
-
Resources: Assignment of team members, tools, or budgets
-
Progress Indicators: Visual cues to show completed vs. pending work
How Does a Gantt Chart Work?
Each task in a Gantt chart is represented by a horizontal bar. The position and length of the bar reflect the start date, duration, and end date. Dependencies are shown as arrows, while progress is often indicated through shading or color.
In project gantt chart tools like Celoxis, these features are interactive—allowing users to drag-and-drop tasks, update statuses in real time, and analyze critical paths easily.
Creating a Gantt Chart: Step-by-Step
-
Define project goals and scope
-
Break down the work into tasks
-
Organize tasks by phases or categories
-
Set start and end dates
-
Identify dependencies between tasks
-
Assign resources (people, tools, budget)
-
Monitor progress and make adjustments
With Celoxis, this entire process is streamlined through its powerful Gantt module, ensuring efficiency and accuracy.
Best Tools for Creating Gantt Charts
While many tools offer Gantt chart functionality, not all are built for performance at scale. Here's how popular solutions compare:
| Tool | Features | Best For |
|---|---|---|
| Celoxis | Advanced Gantt charts, resource allocation, reporting, real-time collaboration | Mid-size to enterprise teams |
| Microsoft Project | Traditional desktop-based planning | Experienced PM professionals |
| Asana | Visual planning with limited Gantt functionality via extensions | Small teams |
| Smartsheet | Spreadsheet-style planning with Gantt capabilities | Business users |
| Trello | Requires Power-Ups for Gantt view | Lightweight task tracking |
Celoxis stands out for its robust features and cost-effective scalability, making it a top choice for professional gantt chart project management.
Best Practices for Using Gantt Charts Effectively
-
Keep it simple: Avoid clutter by limiting tasks to necessary details
-
Update regularly: Reflect real-time progress and changes
-
Use color codes: Differentiate between tasks, phases, and statuses
-
Share with stakeholders: Maintain transparency and alignment
-
Revisit dependencies: Ensure logical task sequencing to avoid delays
Common Mistakes to Avoid
-
Overloading the chart with too many granular tasks
-
Failing to update the chart regularly
-
Setting unrealistic deadlines
-
Ignoring team input during planning
-
Mismanaging task dependencies
Avoiding these pitfalls ensures your Gantt chart remains a useful and up-to-date project control tool.
Frequently Asked Questions
Q1: Can Gantt charts be used for small projects?
Yes, they are suitable for projects of all sizes.
Q2: What’s the difference between Gantt charts and Kanban boards?
Gantt charts focus on time and dependencies; Kanban emphasizes workflow and task status.
Q3: How often should you update a Gantt chart?
Ideally, weekly or after any major project update.
Q4: Do you need expensive software to use Gantt charts?
No. Tools like Celoxis offer enterprise features at a competitive price.
Q5: Can Gantt charts support Agile project management?
Yes. Celoxis allows hybrid methodologies including Agile + Gantt views.
Q6: Can Gantt charts be used for multi-phase projects?
Absolutely. You can group phases, tasks, and milestones clearly within a single timeline.
Q7: How do Gantt charts help with resource management?
They show who is doing what and when—helping avoid overbooking and bottlenecks.
Why Choose Celoxis for Gantt Chart Project Management?
Celoxis offers one of the most advanced Gantt chart project management platforms in the market. Its Gantt module enables teams to:
-
View complex project timelines with ease
-
Automatically track progress and dependencies
-
Allocate and manage resources efficiently
-
Customize views for different stakeholders
-
Integrate with third-party tools for seamless workflows
With Celoxis, your Gantt charts don’t just inform—they drive execution.
Conclusion
Mastering the Gantt chart in project management is essential for any project manager looking to deliver results on time and within budget. With its intuitive interface, customizable views, and real-time tracking capabilities, Celoxis is the ideal platform for implementing powerful, scalable Gantt charts.
Whether you're handling a product launch, client deliverable, or enterprise-wide transformation, Celoxis gives you the visibility and control to execute with confidence.


